How to Use Bollinger Bands for Stock Trading
Introduction to Bollinger Bands
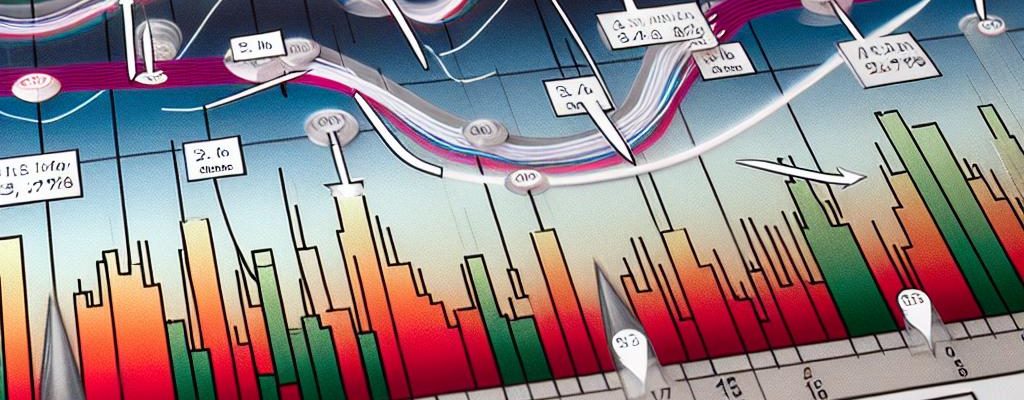
Bollinger Bands are a widely recognized tool in the realm of technical analysis, utilized extensively by traders to gauge the volatility associated with a security’s price. Developed by financial analyst John Bollinger in the 1980s, these bands provide key insights into market behaviors and potential trading opportunities. Bollinger Bands include three distinct lines plotted on a chart: a simple moving average (SMA) line, an upper band, and a lower band. Through these lines, traders can identify conditions where a security might be overbought or oversold and discern possible buy or sell opportunities.
Components of Bollinger Bands
Delving deeper into Bollinger Bands, their construction is comprised of three critical components:
1. Middle Band (SMA): The middle line of the Bollinger Bands is typically a 20-period simple moving average calculated from the closing prices of a security. This average serves as a baseline for understanding general price trends over a specified period.
2. Upper Band: Positioned two standard deviations above the middle band, the upper band reflects price levels that are considerably higher than average, potentially suggesting overbought market conditions.
3. Lower Band: Situated two standard deviations below the middle band, the lower band represents price levels that are well below average, which may indicate oversold conditions.
The utilization of standard deviation, a statistical measure of price volatility, is crucial for defining the upper and lower bands. This calculation allows the bands to adjust dynamically in response to market volatility, thereby providing a real-time gauge of price fluctuations.
Interpreting Bollinger Bands
The fundamental objective of Bollinger Bands is to offer traders a visual and analytical measure of market volatility. Traders interpret these bands in various ways to understand market dynamics:
– When the bands appear far apart, it is indicative of heightened market volatility, wherein prices may swing widely in either direction.
– Conversely, when the bands are situated close together, this signals a period of lower volatility, suggesting that the market price is relatively stable.
– Price movements outside the upper or lower bands can serve as indicators of potential trend reversals or a continuation of the current trend, prompting traders to act accordingly.
Trading Strategies Using Bollinger Bands
Bollinger Bands are integral to the formulation of numerous trading strategies, two of which are particularly noteworthy:
Bollinger Bounce: This strategy is predicated on the tendency for prices to revert to the middle band after touching or breaching the upper or lower bands. Traders often exploit this behavior to predict price corrections, crafting buy or sell strategies that align with the anticipated bounce toward the middle line.
Bollinger Squeeze: A narrowing of the bands, known as a “squeeze,” denotes a phase of low volatility. Such a squeeze typically precedes a strong market breakout, providing savvy traders with an opportunity to position themselves favorably ahead of this impending volatility shift. By monitoring the squeeze indicator, traders can proactively strategize to capitalize on future price movements.
Advantages of Using Bollinger Bands
The deployment of Bollinger Bands offers several noteworthy advantages to traders:
– The bands are inherently adaptive to fluctuating market volatility, providing a dynamic tool that responds to real-time changes in price movement.
– Bollinger Bands deliver a visual representation of the market’s strength or weakness, offering traders a clear snapshot of the current conditions.
– By defining potential trade entry and exit points, Bollinger Bands facilitate informed and calculated trading decisions.
Limitations of Bollinger Bands
While advantageous, Bollinger Bands are not without their limitations:
– Bollinger Bands alone do not furnish explicit trading signals, necessitating their use in conjunction with other technical indicators or market analysis techniques for optimal efficacy.
– In markets characterized by lateral or non-trending dynamics, the effectiveness of Bollinger Bands might diminish, as they are primarily designed to interpret volatility-driven price movements.
– Sole reliance on Bollinger Bands can result in misinterpretations and misguided trading actions. For maximal effectiveness, it is advisable to integrate Bollinger Bands into a broader analytical framework that encompasses diverse market indicators.
Conclusion
Bollinger Bands represent a versatile tool for traders aiming to appraise market volatility and pinpoint prospective trading opportunities. However, their utility is maximized when they are integrated into a comprehensive trading strategy that leverages various analytical resources and insights. To deepen your understanding and proficiency in trading with Bollinger Bands, consider exploring additional materials and platforms that offer sophisticated analytical tools and resources. Through a balanced approach that combines Bollinger Bands with other trading techniques, traders can enhance their decision-making process and optimize their trading outcomes.
This article was last updated on: July 14, 2025